Infinispan Apache Log4j 2 CVE-2021-44228 vulnerability
13 December 2021
Infinispan 10+ uses Log4j version 2.0+ and can be affected by vulnerability CVE-2021-44228, which has a 10.0 CVSS score. The first fixed Log4j version is 2.15.0.
So, until official patch is coming, - you can update used logger version to the latest in few simple steps
- Download Log4j version 2.15.0: https://www.apache.org/dyn/closer.lua/logging/log4j/2.15.0/apache-log4j-2.15.0-bin.zip
- Unpack distributive
- Replace affected libraries
wget https://downloads.apache.org/logging/log4j/2.15.0/apache-log4j-2.15.0-bin.zip
unzip apache-log4j-2.15.0-bin.zip

cd /opt/infinispan-server-10.1.8.Final/lib/

rm log4j-*.jar
cp ~/Downloads/apache-log4j-2.15.0-bin/log4j-api-2.15.0.jar ./
cp ~/Downloads/apache-log4j-2.15.0-bin/log4j-core-2.15.0.jar ./
cp ~/Downloads/apache-log4j-2.15.0-bin/log4j-jul-2.15.0.jar ./
cp ~/Downloads/apache-log4j-2.15.0-bin/log4j-slf4j-impl-2.15.0.jar ./
Please, note - patch above is not official, but according to initial tests it works with no issues
Undertow AJP balancer. UT005028: Proxy request failed: java.nio.BufferOverflowException
03 April 2021
Wildfly provides great out of the box load balancing support by Undertow and modcluster subsystems
Unfortunately, in case HTTP headers size is huge enough (close to 16K), which is so actual in JWT era - pity error happened:
ERROR [io.undertow.proxy] (default I/O-10) UT005028: Proxy request to /ee-jax-rs-examples/clusterdemo/serverinfo failed: java.io.IOException: java.nio.BufferOverflowException
 at io.undertow.server.handlers.proxy.ProxyHandler$HTTPTrailerChannelListener.handleEvent(ProxyHandler.java:771)
 at io.undertow.server.handlers.proxy.ProxyHandler$ProxyAction$1.completed(ProxyHandler.java:646)
 at io.undertow.server.handlers.proxy.ProxyHandler$ProxyAction$1.completed(ProxyHandler.java:561)
 at io.undertow.client.ajp.AjpClientExchange.invokeReadReadyCallback(AjpClientExchange.java:203)
 at io.undertow.client.ajp.AjpClientConnection.initiateRequest(AjpClientConnection.java:288)
 at io.undertow.client.ajp.AjpClientConnection.sendRequest(AjpClientConnection.java:242)
 at io.undertow.server.handlers.proxy.ProxyHandler$ProxyAction.run(ProxyHandler.java:561)
 at io.undertow.util.SameThreadExecutor.execute(SameThreadExecutor.java:35)
 at io.undertow.server.HttpServerExchange.dispatch(HttpServerExchange.java:815)
...
Caused by: java.nio.BufferOverflowException
 at java.nio.Buffer.nextPutIndex(Buffer.java:521)
 at java.nio.DirectByteBuffer.put(DirectByteBuffer.java:297)
 at io.undertow.protocols.ajp.AjpUtils.putString(AjpUtils.java:52)
 at io.undertow.protocols.ajp.AjpClientRequestClientStreamSinkChannel.createFrameHeaderImpl(AjpClientRequestClientStreamSinkChannel.java:176)
 at io.undertow.protocols.ajp.AjpClientRequestClientStreamSinkChannel.generateSendFrameHeader(AjpClientRequestClientStreamSinkChannel.java:290)
 at io.undertow.protocols.ajp.AjpClientFramePriority.insertFrame(AjpClientFramePriority.java:39)
 at io.undertow.protocols.ajp.AjpClientFramePriority.insertFrame(AjpClientFramePriority.java:32)
 at io.undertow.server.protocol.framed.AbstractFramedChannel.flushSenders(AbstractFramedChannel.java:603)
 at io.undertow.server.protocol.framed.AbstractFramedChannel.flush(AbstractFramedChannel.java:742)
 at io.undertow.server.protocol.framed.AbstractFramedChannel.queueFrame(AbstractFramedChannel.java:735)
 at io.undertow.server.protocol.framed.AbstractFramedStreamSinkChannel.queueFinalFrame(AbstractFramedStreamSinkChannel.java:267)
 at io.undertow.server.protocol.framed.AbstractFramedStreamSinkChannel.shutdownWrites(AbstractFramedStreamSinkChannel.java:244)
 at io.undertow.channels.DetachableStreamSinkChannel.shutdownWrites(DetachableStreamSinkChannel.java:79)
 at io.undertow.server.handlers.proxy.ProxyHandler$HTTPTrailerChannelListener.handleEvent(ProxyHandler.java:754)
The same request directly to backend server works well. Tried to play with ajp-listener and mod-cluster filter "max-*" parameters, but have no luck.
Possible solution here is switch protocol from AJP to HTTP which can be bit less effective, but works well with big headers:
/profile=full-ha/subsystem=modcluster/proxy=default:write-attribute(name=listener, value=default)
Improve Oracle JDBC performance by fetch size tuning
28 December 2020
By default, when Oracle JDBC driver executes query, it retrieves a result set of 10 rows at a time from the database cursor. Low fetch size value might cause more roundtrips to DB and this leads to a longer time to fetch results from queries. You can change the number of rows retrieved with each trip to the database cursor by changing the row fetch size value.
Statement, PreparedStatement, CallableStatement, and ResultSet provides next methods for dealing with fetch size:
void setFetchSize(int rows) throws SQLException

int getFetchSize() throws SQLException
Default fetch size value can be changed by defaultRowPrefetch connection property:
On Wildfly Application Server DataSource level by:
[standalone@localhost:9990 /] /subsystem=datasources/data-source=ExampleOraDS/connection-properties=defaultRowPrefetch:add(value=1000)
On Hibernate level by hibernate.jdbc.fetch_size property:
<properties>
  ...
  <property name="hibernate.jdbc.fetch_size" value="1000" />
  ...
</properties>
I did simple test:
@Test
public void defaultRowPrefetchTest() throws Exception {
   EntityManager em = Persistence.createEntityManagerFactory("myDSTestOra").createEntityManager();

   Long time = System.currentTimeMillis();

   Query q = em.createNativeQuery("SELECT * FROM MY_TABLE", Tuple.class);
   List<Tuple> resultList = q.getResultList();

   System.out.println(System.currentTimeMillis() - time);
}
And on my laptop, fetching of 16K records takes ~185 ms with default value and ~86 ms with defaultRowPrefetch = 20000. As you can see from the result - there is more than x2 performance improvement.
Source code of test case on GitHub
Microprofile metrics with Wildfly Application Server
27 December 2020
Any enterprise application can't be completely successful on production without good monitoring solution. For years vendors and developers provided custom tooling for it. Since Eclipse Microprofile Metrics specification we have a unified way to export monitoring data to the management agents and unified Java API, that developers can use to expose their telemetry data.
Wildfly application server provides microprofile metrics support, but unfortunately only for standalone configurations yet. In case domain mode you can provide necessary dependencies
dependencies {
    compile group: 'org.eclipse.microprofile.metrics', name: 'microprofile-metrics-api', version: '2.3'
    compile group: 'io.smallrye', name: 'smallrye-metrics', version: '2.4.0'
}
and then expose application scope metrics through custom endpoint like
import io.smallrye.metrics.exporters.JsonExporter;
import io.smallrye.metrics.exporters.OpenMetricsExporter;
...
@Singleton
@Path("/metrics")
public class MetricsTestResource {

  private OpenMetricsExporter openMetricsExporter = new OpenMetricsExporter();
  private JsonExporter jsonExporter = new JsonExporter();

  @GET
  @Path("/prmths")
  public String prometheus() {
    return openMetricsExporter.exportAllScopes().toString();
  }

  @GET
  @Path("/json")
  public String json() {
    return jsonExporter.exportAllScopes().toString();
  }
JVM and subsystems metrics will not be available by endpoint above, but them you can obtain through old good JMX.
Standalone server from the box provides metrics in prometheus format for all scopes over management interface (port 9990 ) using org.wildfly.extension.microprofile.metrics-smallrye extension and microprofile-metrics-smallrye subsystem.
kostenko@kostenko:$ curl http://127.0.0.1:9990/metrics/
# HELP base_classloader_loadedClasses_count Displays the number of classes that are currently loaded in the Java virtual machine.
# TYPE base_classloader_loadedClasses_count gauge
base_classloader_loadedClasses_count 11826.0
# HELP base_cpu_availableProcessors Displays the number of processors available to the Java virtual machine. This value may change during a particular invocation of the virtual machine.
# TYPE base_cpu_availableProcessors gauge
base_cpu_availableProcessors 8.0
...
For developers available next annotations (sorry for the low output examples values):
- @Counted - counter, which counts the invocations of the annotated object.
# TYPE application_org_kostenko_examples_microprofile_metrics_MetricsTestResource_prometheus_total counter application_org_kostenko_examples_microprofile_metrics_MetricsTestResource_prometheus_total 1.0 - @ConcurrentGauge - gauge which counts the parallel invocations of the annotated object.
# TYPE application_org_kostenko_examples_microprofile_metrics_MetricsTestResource_prometheus_current gauge application_org_kostenko_examples_microprofile_metrics_MetricsTestResource_prometheus_current 1.0 # TYPE application_org_kostenko_examples_microprofile_metrics_MetricsTestResource_prometheus_max gauge application_org_kostenko_examples_microprofile_metrics_MetricsTestResource_prometheus_max 1.0 # TYPE application_org_kostenko_examples_microprofile_metrics_MetricsTestResource_prometheus_min gauge application_org_kostenko_examples_microprofile_metrics_MetricsTestResource_prometheus_min 0.0 - @Gauge - gauge, which samples the value of the annotated object.
# TYPE application_org_kostenko_examples_microprofile_metrics_MetricsTestResource_json gauge application_org_kostenko_examples_microprofile_metrics_MetricsTestResource_json 123.0 - @Metered - meter, which tracks the frequency of invocations of the annotated object.
# TYPE application_org_kostenko_examples_microprofile_metrics_MetricsTestResource_prometheus_total counter application_org_kostenko_examples_microprofile_metrics_MetricsTestResource_prometheus_total 6.0 # TYPE application_org_kostenko_examples_microprofile_metrics_MetricsTestResource_prometheus_rate_per_second gauge application_org_kostenko_examples_microprofile_metrics_MetricsTestResource_prometheus_rate_per_second 0.209682602430885 # TYPE application_org_kostenko_examples_microprofile_metrics_MetricsTestResource_prometheus_one_min_rate_per_second gauge application_org_kostenko_examples_microprofile_metrics_MetricsTestResource_prometheus_one_min_rate_per_second 0.015991117074135343 # TYPE application_org_kostenko_examples_microprofile_metrics_MetricsTestResource_prometheus_five_min_rate_per_second gauge application_org_kostenko_examples_microprofile_metrics_MetricsTestResource_prometheus_five_min_rate_per_second 0.0033057092356765017 # TYPE application_org_kostenko_examples_microprofile_metrics_MetricsTestResource_prometheus_fifteen_min_rate_per_second gauge application_org_kostenko_examples_microprofile_metrics_MetricsTestResource_prometheus_fifteen_min_rate_per_second 0.0011080303990206543 - @Metric - annotation that contains the metadata information when requesting a metric to be injected.
- @Timed - timer, which tracks duration of the annotated object.
# TYPE application_org_kostenko_examples_microprofile_metrics_MetricsTestResource_prometheus_rate_per_second gauge application_org_kostenko_examples_microprofile_metrics_MetricsTestResource_prometheus_rate_per_second 0.09811766798116955 # TYPE application_org_kostenko_examples_microprofile_metrics_MetricsTestResource_prometheus_one_min_rate_per_second gauge application_org_kostenko_examples_microprofile_metrics_MetricsTestResource_prometheus_one_min_rate_per_second 0.030703655021877174 # TYPE application_org_kostenko_examples_microprofile_metrics_MetricsTestResource_prometheus_five_min_rate_per_second gauge application_org_kostenko_examples_microprofile_metrics_MetricsTestResource_prometheus_five_min_rate_per_second 0.0065567799035988195 # TYPE application_org_kostenko_examples_microprofile_metrics_MetricsTestResource_prometheus_fifteen_min_rate_per_second gauge application_org_kostenko_examples_microprofile_metrics_MetricsTestResource_prometheus_fifteen_min_rate_per_second 0.002209922141215539 # TYPE application_org_kostenko_examples_microprofile_metrics_MetricsTestResource_prometheus_min_seconds gauge application_org_kostenko_examples_microprofile_metrics_MetricsTestResource_prometheus_min_seconds 5.88813E-4 # TYPE application_org_kostenko_examples_microprofile_metrics_MetricsTestResource_prometheus_max_seconds gauge application_org_kostenko_examples_microprofile_metrics_MetricsTestResource_prometheus_max_seconds 0.005724684 # TYPE application_org_kostenko_examples_microprofile_metrics_MetricsTestResource_prometheus_mean_seconds gauge application_org_kostenko_examples_microprofile_metrics_MetricsTestResource_prometheus_mean_seconds 0.0030220556126073638 # TYPE application_org_kostenko_examples_microprofile_metrics_MetricsTestResource_prometheus_stddev_seconds gauge application_org_kostenko_examples_microprofile_metrics_MetricsTestResource_prometheus_stddev_seconds 0.0025644006235855748 # TYPE application_org_kostenko_examples_microprofile_metrics_MetricsTestResource_prometheus_seconds summary application_org_kostenko_examples_microprofile_metrics_MetricsTestResource_prometheus_seconds_count 2.0 application_org_kostenko_examples_microprofile_metrics_MetricsTestResource_prometheus_seconds{quantile="0.5"} 5.88813E-4 application_org_kostenko_examples_microprofile_metrics_MetricsTestResource_prometheus_seconds{quantile="0.75"} 0.005724684 application_org_kostenko_examples_microprofile_metrics_MetricsTestResource_prometheus_seconds{quantile="0.95"} 0.005724684 application_org_kostenko_examples_microprofile_metrics_MetricsTestResource_prometheus_seconds{quantile="0.98"} 0.005724684 application_org_kostenko_examples_microprofile_metrics_MetricsTestResource_prometheus_seconds{quantile="0.99"} 0.005724684 application_org_kostenko_examples_microprofile_metrics_MetricsTestResource_prometheus_seconds{quantile="0.999"} 0.005724684 - @SimplyTimed - simple timer, which tracks duration and invocations of the annotated object.
# TYPE application_org_kostenko_examples_microprofile_metrics_MetricsTestResource_prometheus_total counter
application_org_kostenko_examples_microprofile_metrics_MetricsTestResource_prometheus_total 1.0
# TYPE application_org_kostenko_examples_microprofile_metrics_MetricsTestResource_prometheus_elapsedTime_seconds gauge
application_org_kostenko_examples_microprofile_metrics_MetricsTestResource_prometheus_elapsedTime_seconds 0.005032859
Prometheus is a free software application used for event monitoring and alerting. It records real-time metrics in a time series database (allowing for high dimensionality) built using a HTTP pull model, with flexible queries and real-time alerting.
Let's setup above and check how metrics monitoring with Prometheus looks on practice:
wget https://github.com/prometheus/prometheus/releases/download/v2.23.0/prometheus-2.23.0.linux-amd64.tar.gz
tar xvfz prometheus-*.tar.gz
cd prometheus-*
To provide path to the metrics endpoint edit prometheus.yml and provide correct metrics_path and targets
# Here it's Prometheus itself.
scrape_configs:
  # The job name is added as a label `job=<job_name>` to any timeseries scraped from this config.
  - job_name: 'prometheus'

    # metrics_path defaults to '/metrics'
    # scheme defaults to 'http'.

    static_configs:
    - targets: ['127.0.0.1:9990']
This is it! http://localhost:9090/graph :
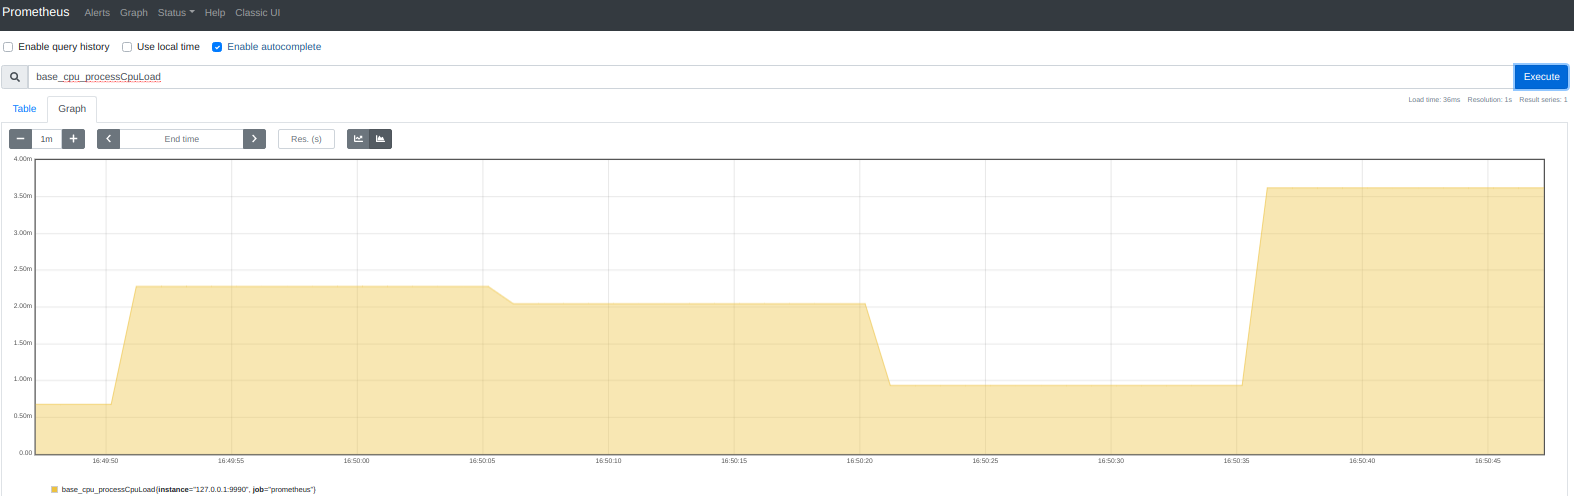
Now our metrics is collecting and can be visualized over standard prometheus UI(shown above) or easy integrated with grafana
Source code of custom metrics endpoint example available on GitHub
Infinispan Server as Wildfly remote cache container for your Jakarta EE application
29 November 2020

Recently i wrote a few articles about using infinispan cache based on Wildfly infinispan subsystem. But even though Wildfly provides well cache containers management support, - from the high load and high availability points of view, make sense to take a look to separate clustered cache instances.
PROS:
- Heap, threads, GC pauses separated between application and cache containers.
- Application or cache can be scaled separately depends on needs
- More configuration possibilities (like ASYNC replication etc)
- Minimizing affect of application to cache distribution and visa verse
- Application containers restart keeps stored cache data
CONS:
- Increase infrastructure complexity
- Additional support and monitoring unit
- Additional costs in case separate cache cloud nodes
Fortunately, with Wildfly Application Server it easy enough to switch between embedded and remote cache containers even in runtime (just another JNDI lookup). So, let's try it out! And first, we need to download stable infinispan server release. I have chosen 10.1.8 as my Wildfly 20 uses this one and potential compatibility issues should be excluded.
After download, please extract distribution archive and run infinispan server
kostenko@kostenko:/opt/infinispan-server-10.1.8.Final/bin$ ./server.sh
By default infinispan server will use port 11222 on 127.0.0.1. To bind another IP just use -b binding parameter like -b 0.0.0.0 on startup.
To create named cache you can use provided UI (http://127.0.0.1:11222/) or cli console like
/opt/iplatform/infinispan/bin/cli.sh
[disconnected]> connect
create cache --template=org.infinispan.REPL_ASYNC myremotecache
Now let's perform Wildfly configuration to use remote cache container
/socket-binding-group=standard-sockets/remote-destination-outbound-socket-binding=ispn1:add(host=127.0.0.1, port=11222)
batch
/subsystem=infinispan/remote-cache-container=myRemoteContainer:add(default-remote-cluster=data-grid-cluster)
/subsystem=infinispan/remote-cache-container=myRemoteContainer/remote-cluster=data-grid-cluster:add(socket-bindings=[ispn1])
run-batch
Actually, we just have finished with environment configuration and now we are ready for application development. As usual, Jakarta EE build.gradle looks pretty laconical:
apply plugin: 'war'
dependencies {
    providedCompile "jakarta.platform:jakarta.jakartaee-api:8.0.0"
    providedCompile "org.infinispan:infinispan-core:10.1.8.Final"
    providedCompile "org.infinispan:infinispan-client-hotrod:10.1.8.Final"
}
To use configured cache container just inject registered @Resource:
@Named
public class TestCacheService {

    public static final String REMOTE_CACHE_NAME = "myremotecache";

    @Resource(lookup = "java:jboss/infinispan/remote-container/myRemoteContainer")
    org.infinispan.client.hotrod.RemoteCacheContainer remoteCacheContainer;

    public void putRemoteCache(String key, String value) {
        remoteCacheContainer.getCache(REMOTE_CACHE_NAME).put(key, String.format("%s (%s)", value, new Date()));
    }

    public Object getRemoteCache(String key) {
        return remoteCacheContainer.getCache(REMOTE_CACHE_NAME).get(key);
    }
}
Also, you can provide resource reference by WEB-INF/web.xml descriptor and use shorter resource lookup by name like @Resource(name = "myremotecontainer")
<resource-env-ref>
    <resource-env-ref-name>myremotecontainer</resource-env-ref-name>
    <lookup-name>java:jboss/infinispan/remote-container/myRemoteContainer</lookup-name>
</resource-env-ref>
Last thing we need, - is provide module dependencies by MANIFEST.MF:
Manifest-Version: 1.0
Dependencies: org.infinispan, org.infinispan.commons, org.infinispan.client.hotrod export
OR through jboss-deployment-structure.xml :
<jboss-deployment-structure>
   <deployment>
      <dependencies>
         <module name="org.infinispan" export="TRUE" />
         <module name="org.infinispan.commons" export="TRUE" />
         <module name="org.infinispan.client.hotrod" export="TRUE" />
      </dependencies>
   </deployment>
</jboss-deployment-structure>
This is it! Build, deploy, and test it out.
curl -o - "http://localhost:8080/jcache-examples/jcache/ispn-remote-put?key=KEY1&value=VALUE1"
ok
curl -o - "http://localhost:8080/jcache-examples/jcache/ispn-remote-get?key=KEY1"
VALUE1 (Sat Nov 28 20:48:51 EET 2020)
To check remote cache container statistics you can use UI or Infinispan CLI console:
[disconnected]> connect
cd caches
stats myremotecache
{
  "time_since_start" : 23866,
  "time_since_reset" : 23866,
  "current_number_of_entries" : 1,
  "current_number_of_entries_in_memory" : 1,
  "total_number_of_entries" : 1,
  "off_heap_memory_used" : 0,
  ...
Last point i would like to pay attention is cache container height availability with Infinispan clustering. By default, Infinispan uses MPING (multicast) protocol to cluster auto discovery. You can easy check it just by running another ISPN instances on some network. For example:
$ cd <ISPN_HOME>
$ cp -r server server2
$ bin/server.sh -o 100 -s server2

$ bin/cli.sh
connect
describe
{
  "version" : "10.1.8.Final",
  ...
  "cluster_members_physical_addresses" : [ "127.0.0.1:7800", "127.0.0.1:7801" ],
  "cluster_size" : 2,
  ...
}
Do not forget to add new ISPN node to your Wildfly configuration
/socket-binding-group=standard-sockets/remote-destination-outbound-socket-binding=ispn2:add(host=127.0.0.1, port=11322)
/subsystem=infinispan/remote-cache-container=myRemoteContainer/remote-cluster=data-grid-cluster:write-attribute(name=socket-bindings, value=[ispn1,ispn2])
Please, notice if you perform cloud deployment or have some network restrictions, - auto discovery with MPING can be not accessible. In this case you can use a static list of IP addresses by providing TCPPING configuration via server/conf/infinispan.xml. Just add jgroups section and edit transport stack for default cache-container :
<infinispan>

 <jgroups>
    <stack name="mytcpping">
      <TCP bind_port="7800" port_range="30" recv_buf_size="20000000" send_buf_size="640000"/>
      <TCPPING   initial_hosts="${jgroups.tcpping.initial_hosts:127.0.0.1[7800],127.0.0.1[7800]}"/>
      <MERGE3 />
      <FD_SOCK />
      <FD_ALL timeout="3000" interval="1000" timeout_check_interval="1000" />
      <VERIFY_SUSPECT timeout="1000" />
      <pbcast.NAKACK2 use_mcast_xmit="false" xmit_interval="100" xmit_table_num_rows="50" xmit_table_msgs_per_row="1024" xmit_table_max_compaction_time="30000" />
      <UNICAST3 xmit_interval="100" xmit_table_num_rows="50" xmit_table_msgs_per_row="1024" xmit_table_max_compaction_time="30000" />
      <pbcast.STABLE stability_delay="200" desired_avg_gossip="2000" max_bytes="1M" />
      <pbcast.GMS print_local_addr="false" join_timeout="${jgroups.join_timeout:2000}" />
      <UFC max_credits="4m" min_threshold="0.40" />
      <MFC max_credits="4m" min_threshold="0.40" />
      <FRAG3 />
    </stack>
  </jgroups>

   <cache-container name="default" statistics="true">
     <transport stack="mytcpping" node-name="${infinispan.node.name:}"/>
   </cache-container>
...
For more details about configuration, please refer to WildFly 20 Infinispan Model Reference and Infinispan community documentation
Source code of described example available on GitHub