Microprofile metrics with Wildfly Application Server
27 December 2020
Any enterprise application can't be completely successful on production without good monitoring solution. For years vendors and developers provided custom tooling for it. Since Eclipse Microprofile Metrics specification we have a unified way to export monitoring data to the management agents and unified Java API, that developers can use to expose their telemetry data.
Wildfly application server provides microprofile metrics support, but unfortunately only for standalone configurations yet. In case domain mode you can provide necessary dependencies
dependencies {
    compile group: 'org.eclipse.microprofile.metrics', name: 'microprofile-metrics-api', version: '2.3'
    compile group: 'io.smallrye', name: 'smallrye-metrics', version: '2.4.0'
}
and then expose application scope metrics through custom endpoint like
import io.smallrye.metrics.exporters.JsonExporter;
import io.smallrye.metrics.exporters.OpenMetricsExporter;
...
@Singleton
@Path("/metrics")
public class MetricsTestResource {

  private OpenMetricsExporter openMetricsExporter = new OpenMetricsExporter();
  private JsonExporter jsonExporter = new JsonExporter();

  @GET
  @Path("/prmths")
  public String prometheus() {
    return openMetricsExporter.exportAllScopes().toString();
  }

  @GET
  @Path("/json")
  public String json() {
    return jsonExporter.exportAllScopes().toString();
  }
JVM and subsystems metrics will not be available by endpoint above, but them you can obtain through old good JMX.
Standalone server from the box provides metrics in prometheus format for all scopes over management interface (port 9990 ) using org.wildfly.extension.microprofile.metrics-smallrye extension and microprofile-metrics-smallrye subsystem.
kostenko@kostenko:$ curl http://127.0.0.1:9990/metrics/
# HELP base_classloader_loadedClasses_count Displays the number of classes that are currently loaded in the Java virtual machine.
# TYPE base_classloader_loadedClasses_count gauge
base_classloader_loadedClasses_count 11826.0
# HELP base_cpu_availableProcessors Displays the number of processors available to the Java virtual machine. This value may change during a particular invocation of the virtual machine.
# TYPE base_cpu_availableProcessors gauge
base_cpu_availableProcessors 8.0
...
For developers available next annotations (sorry for the low output examples values):
- @Counted - counter, which counts the invocations of the annotated object.
# TYPE application_org_kostenko_examples_microprofile_metrics_MetricsTestResource_prometheus_total counter application_org_kostenko_examples_microprofile_metrics_MetricsTestResource_prometheus_total 1.0 - @ConcurrentGauge - gauge which counts the parallel invocations of the annotated object.
# TYPE application_org_kostenko_examples_microprofile_metrics_MetricsTestResource_prometheus_current gauge application_org_kostenko_examples_microprofile_metrics_MetricsTestResource_prometheus_current 1.0 # TYPE application_org_kostenko_examples_microprofile_metrics_MetricsTestResource_prometheus_max gauge application_org_kostenko_examples_microprofile_metrics_MetricsTestResource_prometheus_max 1.0 # TYPE application_org_kostenko_examples_microprofile_metrics_MetricsTestResource_prometheus_min gauge application_org_kostenko_examples_microprofile_metrics_MetricsTestResource_prometheus_min 0.0 - @Gauge - gauge, which samples the value of the annotated object.
# TYPE application_org_kostenko_examples_microprofile_metrics_MetricsTestResource_json gauge application_org_kostenko_examples_microprofile_metrics_MetricsTestResource_json 123.0 - @Metered - meter, which tracks the frequency of invocations of the annotated object.
# TYPE application_org_kostenko_examples_microprofile_metrics_MetricsTestResource_prometheus_total counter application_org_kostenko_examples_microprofile_metrics_MetricsTestResource_prometheus_total 6.0 # TYPE application_org_kostenko_examples_microprofile_metrics_MetricsTestResource_prometheus_rate_per_second gauge application_org_kostenko_examples_microprofile_metrics_MetricsTestResource_prometheus_rate_per_second 0.209682602430885 # TYPE application_org_kostenko_examples_microprofile_metrics_MetricsTestResource_prometheus_one_min_rate_per_second gauge application_org_kostenko_examples_microprofile_metrics_MetricsTestResource_prometheus_one_min_rate_per_second 0.015991117074135343 # TYPE application_org_kostenko_examples_microprofile_metrics_MetricsTestResource_prometheus_five_min_rate_per_second gauge application_org_kostenko_examples_microprofile_metrics_MetricsTestResource_prometheus_five_min_rate_per_second 0.0033057092356765017 # TYPE application_org_kostenko_examples_microprofile_metrics_MetricsTestResource_prometheus_fifteen_min_rate_per_second gauge application_org_kostenko_examples_microprofile_metrics_MetricsTestResource_prometheus_fifteen_min_rate_per_second 0.0011080303990206543 - @Metric - annotation that contains the metadata information when requesting a metric to be injected.
- @Timed - timer, which tracks duration of the annotated object.
# TYPE application_org_kostenko_examples_microprofile_metrics_MetricsTestResource_prometheus_rate_per_second gauge application_org_kostenko_examples_microprofile_metrics_MetricsTestResource_prometheus_rate_per_second 0.09811766798116955 # TYPE application_org_kostenko_examples_microprofile_metrics_MetricsTestResource_prometheus_one_min_rate_per_second gauge application_org_kostenko_examples_microprofile_metrics_MetricsTestResource_prometheus_one_min_rate_per_second 0.030703655021877174 # TYPE application_org_kostenko_examples_microprofile_metrics_MetricsTestResource_prometheus_five_min_rate_per_second gauge application_org_kostenko_examples_microprofile_metrics_MetricsTestResource_prometheus_five_min_rate_per_second 0.0065567799035988195 # TYPE application_org_kostenko_examples_microprofile_metrics_MetricsTestResource_prometheus_fifteen_min_rate_per_second gauge application_org_kostenko_examples_microprofile_metrics_MetricsTestResource_prometheus_fifteen_min_rate_per_second 0.002209922141215539 # TYPE application_org_kostenko_examples_microprofile_metrics_MetricsTestResource_prometheus_min_seconds gauge application_org_kostenko_examples_microprofile_metrics_MetricsTestResource_prometheus_min_seconds 5.88813E-4 # TYPE application_org_kostenko_examples_microprofile_metrics_MetricsTestResource_prometheus_max_seconds gauge application_org_kostenko_examples_microprofile_metrics_MetricsTestResource_prometheus_max_seconds 0.005724684 # TYPE application_org_kostenko_examples_microprofile_metrics_MetricsTestResource_prometheus_mean_seconds gauge application_org_kostenko_examples_microprofile_metrics_MetricsTestResource_prometheus_mean_seconds 0.0030220556126073638 # TYPE application_org_kostenko_examples_microprofile_metrics_MetricsTestResource_prometheus_stddev_seconds gauge application_org_kostenko_examples_microprofile_metrics_MetricsTestResource_prometheus_stddev_seconds 0.0025644006235855748 # TYPE application_org_kostenko_examples_microprofile_metrics_MetricsTestResource_prometheus_seconds summary application_org_kostenko_examples_microprofile_metrics_MetricsTestResource_prometheus_seconds_count 2.0 application_org_kostenko_examples_microprofile_metrics_MetricsTestResource_prometheus_seconds{quantile="0.5"} 5.88813E-4 application_org_kostenko_examples_microprofile_metrics_MetricsTestResource_prometheus_seconds{quantile="0.75"} 0.005724684 application_org_kostenko_examples_microprofile_metrics_MetricsTestResource_prometheus_seconds{quantile="0.95"} 0.005724684 application_org_kostenko_examples_microprofile_metrics_MetricsTestResource_prometheus_seconds{quantile="0.98"} 0.005724684 application_org_kostenko_examples_microprofile_metrics_MetricsTestResource_prometheus_seconds{quantile="0.99"} 0.005724684 application_org_kostenko_examples_microprofile_metrics_MetricsTestResource_prometheus_seconds{quantile="0.999"} 0.005724684 - @SimplyTimed - simple timer, which tracks duration and invocations of the annotated object.
# TYPE application_org_kostenko_examples_microprofile_metrics_MetricsTestResource_prometheus_total counter
application_org_kostenko_examples_microprofile_metrics_MetricsTestResource_prometheus_total 1.0
# TYPE application_org_kostenko_examples_microprofile_metrics_MetricsTestResource_prometheus_elapsedTime_seconds gauge
application_org_kostenko_examples_microprofile_metrics_MetricsTestResource_prometheus_elapsedTime_seconds 0.005032859
Prometheus is a free software application used for event monitoring and alerting. It records real-time metrics in a time series database (allowing for high dimensionality) built using a HTTP pull model, with flexible queries and real-time alerting.
Let's setup above and check how metrics monitoring with Prometheus looks on practice:
wget https://github.com/prometheus/prometheus/releases/download/v2.23.0/prometheus-2.23.0.linux-amd64.tar.gz
tar xvfz prometheus-*.tar.gz
cd prometheus-*
To provide path to the metrics endpoint edit prometheus.yml and provide correct metrics_path and targets
# Here it's Prometheus itself.
scrape_configs:
  # The job name is added as a label `job=<job_name>` to any timeseries scraped from this config.
  - job_name: 'prometheus'

    # metrics_path defaults to '/metrics'
    # scheme defaults to 'http'.

    static_configs:
    - targets: ['127.0.0.1:9990']
This is it! http://localhost:9090/graph :
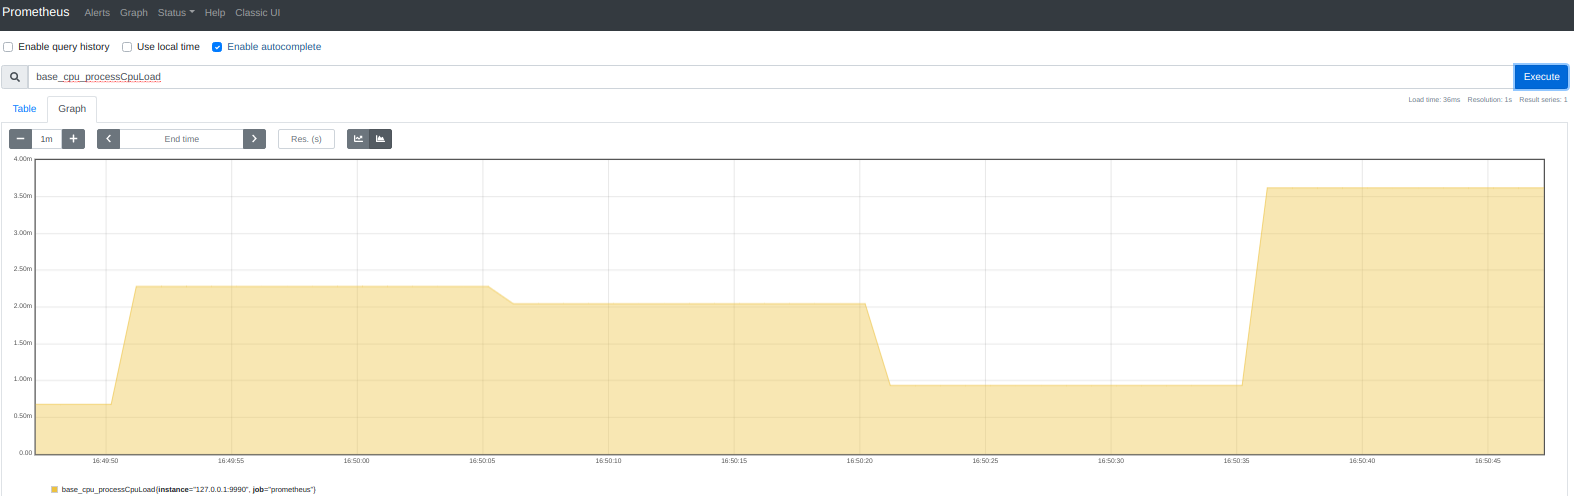
Now our metrics is collecting and can be visualized over standard prometheus UI(shown above) or easy integrated with grafana
Source code of custom metrics endpoint example available on GitHub